vSAN 7.0 U1 – new features spotted (part 2)

While browsing the familiar vCenter UI right after an upgrade from 6.7U3 to 7.0U1 I noticed some small but nice changes I wanted to share.

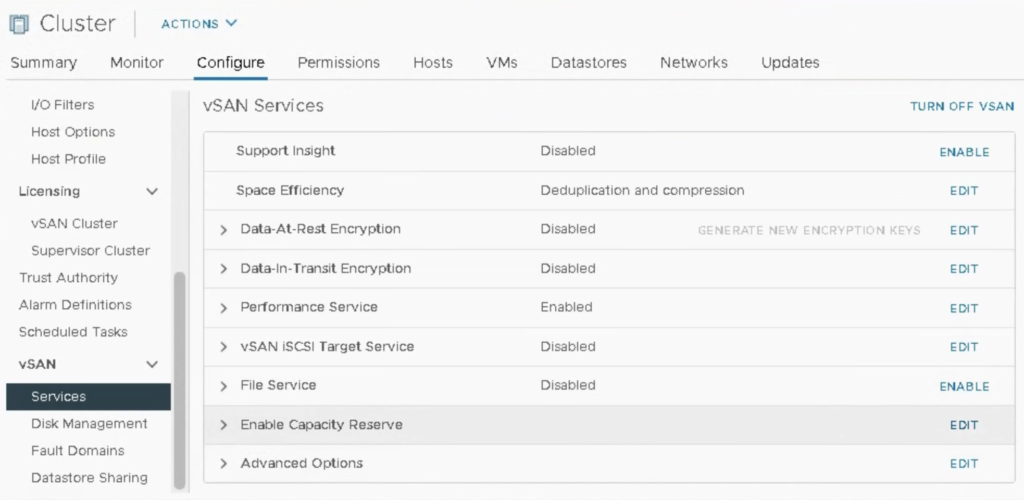
Enable Capacity Reserve for vSAN datastore

Cluster -> Configure-> vSAN Services: this part just got a new option: Enable Capacity Reserve. To be able to see the benefits of this improvement, lets see how it was in pre-7.0 era.

In my 4-node vSAN cluster where hosts have around 17,49 TB capacity each, the datastore capacity is 69,86 TB. When actually written capacity (used by VM) reached 49,47 TB which was more than 70% of the cluster space, it was still ‘all green’ for the cluster in CAPACITY USAGE view. Don’t look at dedupe savings, this is just a test environment.

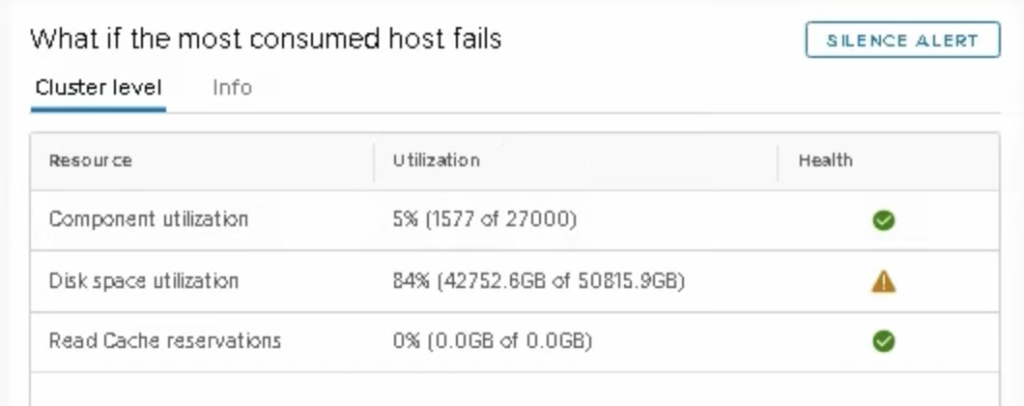
The only indication that the datastore was getting full and that we could potentially run into rebuild issues if a host failed was vSAN Skyline Health check “What if the most consumed host fails”.

In this situation having datastore which was 70% full already and 47 TB of VM data, loosing 17,49 TB would mean datastore size around 52 TB. 47/52 means datastore full in 90%. But I was still able to create new VMs, this limit was soft.

For vSAN 6.7 to stay on the safe side we had to use fixed 25-30% of slack (free) space regardless of the cluster size. 25-30% guaranteed there would be enough space for rebuilds and cluster operations in case of a node failure but in many cases it was too much and not everyone was an expert in monitoring the cluster size. On the other hand, not everyone could afford to constantly monitor the space making sure no one creates an automation task to provision hundreds of VMs over the weekend that could make vSAN datastore full.

Capacity Reserve is a feature that helps to control the vSAN capacity and is specific to your cluster size. It will also protect the cluster from provisioning new VMs, so datastore will not get full.
In my case, I still have 4-node vSAN Cluster with capacity 69,86 TB. When I enable Capacity Reserve feature, my VMs use only 9,19 TB of vSAN datastore. I don’t get to set the capacity reservations, the exact values are calculated and set for me. When I select Operations reserve, it is up to me to select also Host rebuild reserve (the first one has to be selected to be able to select the second).
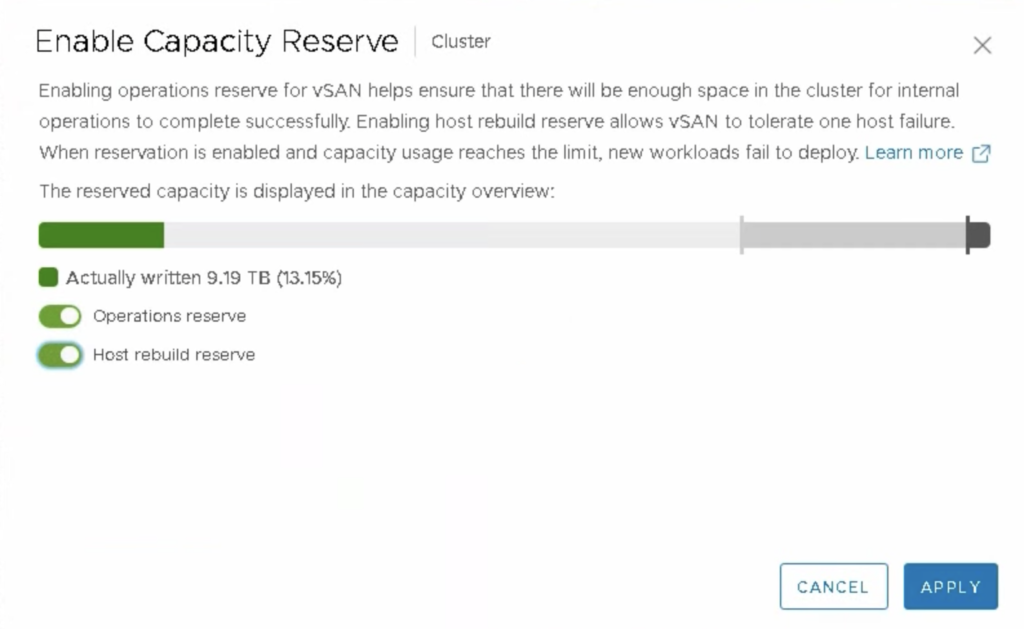
Looking at capacity Overview of the vSAN datastore, I see that the system has reserved 16,54 TB for the host rebuild (23.68 %) and 1.78 TB for operations (2.54%).

When I create more VMs and vSAN tasks, my capacity utilisation reaches 45.45 TB (the utilisation is now almost the same as in the first scenario). I can also see the Operations reserve increased to 7.08 TB (10%). It is because I created more VMs and more tasks so more cluster resources would be needed for operations.

You can see Capacity Overview changed colour to yellow, showing I am reaching my space limit. Actually “free” space on disks is now 815 GB. The remaining capacity is secured in case of a host failure or rebuilds.

You can also see an alert in vCenter: vSAN Health alarm “Cluster disk space utilization” triggered although cluster still has free capacity. Isn’t it little bit like HA Admission Control for a storage?

Even though there was still some space on vSAN datastore, it prevented me from creating new VMs.

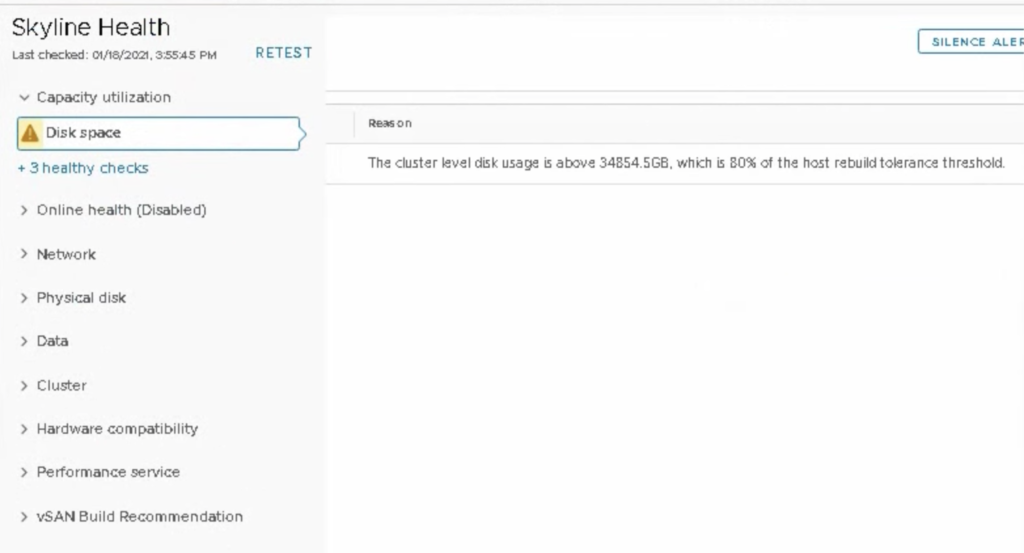
We also get Disk space vSAN Health alert “This cluster level disk usage is above 34 854 GB, which is 80% of the host rebuild tolerance threshold”.
And in addition to that, also ‘What if the most consumed host fails’ is triggered independently of the other alerts.
It seems the feature is very effective and finally we can put a hard stop and prevent vSAN from getting full.

vSAN 7.0 U1 – new features spotted (part 1)

While browsing the familiar vCenter UI right after an upgrade from 6.7U3 to 7.0U1 I noticed some small but nice changes I wanted to share.

RAID_D for integrity

When we put a host in Maintenance Mode with Ensure Accessibility option we will see a new RAID type ->RAID_D. It guarantees that all new write operations have two copies of data (for data integrity). In the example below esxi-59 is in MM, so all new writes go to esxi-74 (as a backup for esxi-59) and to esxi-79. Note that Witness object in this example is also on esxi-74 node as the RAID_D component. It is because we have 3 node vSAN cluster.

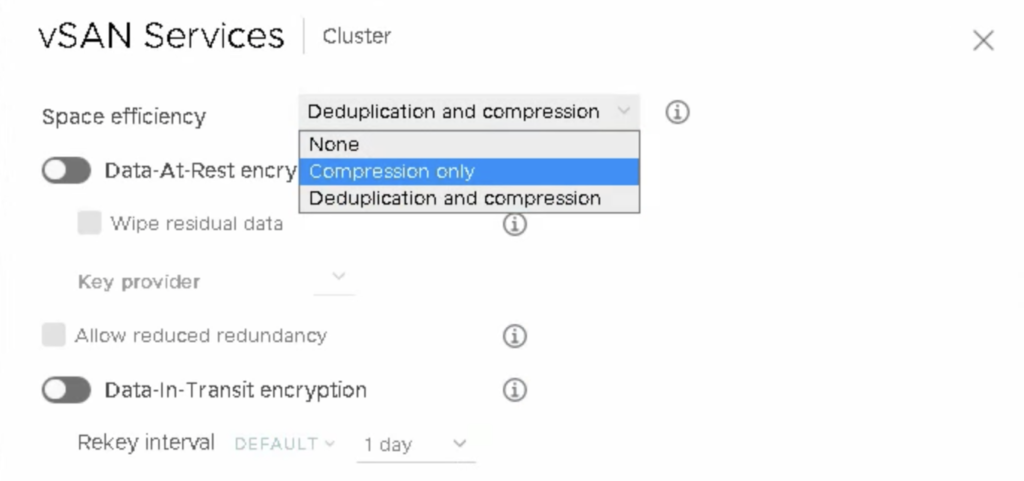
Compression ONLY

If the workload is not dedupe – friendly but can benefit from compression, now there is an option to enable Compression only on vSAN all-flesh datastore. The bonus is (in comparison to dedupe & compression) that in case of a failure of a capacity disk, whole disk group will NOT be unmounted.

Datastore Sharing aka HCI Mesh

If you have more than 2 clusters under the same vCenter, you can mount vSAN datastore from the remote cluster and use as a spare capacity for VMs.

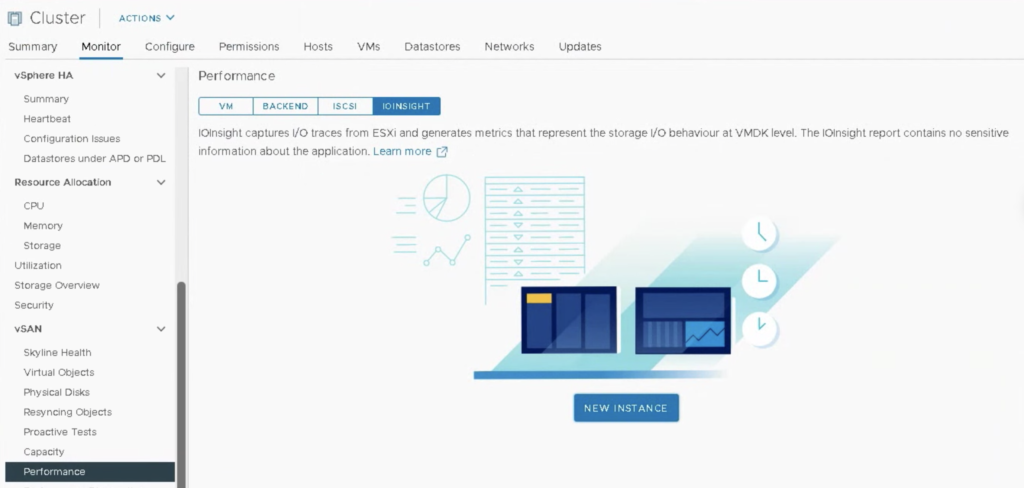
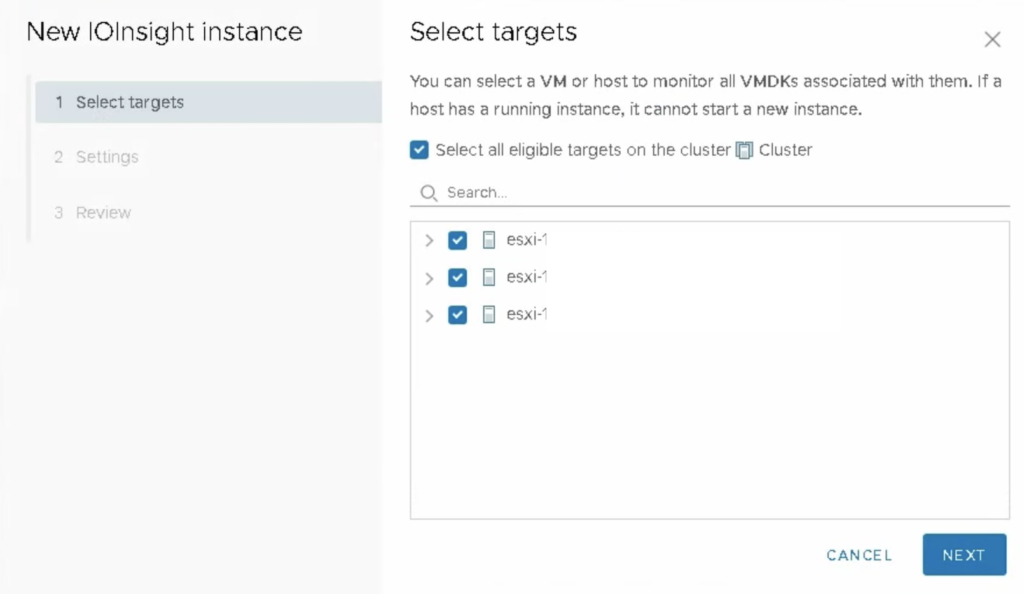
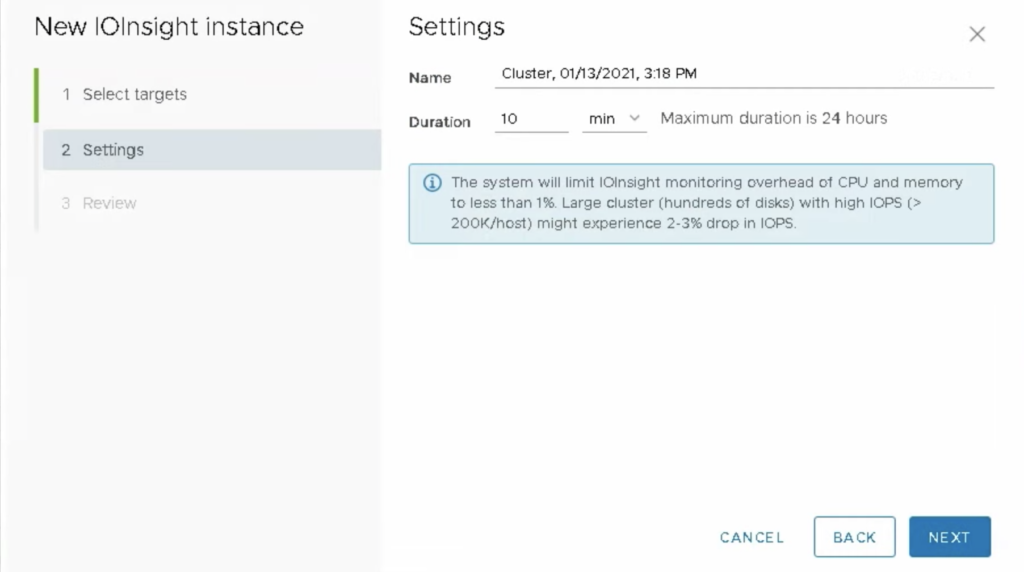
IOINSIGHT

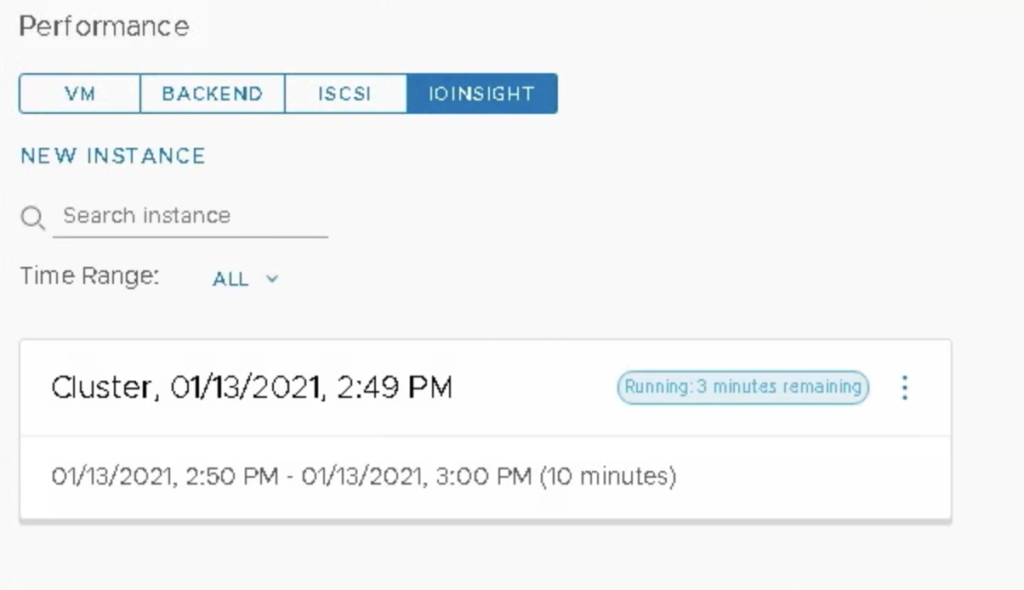
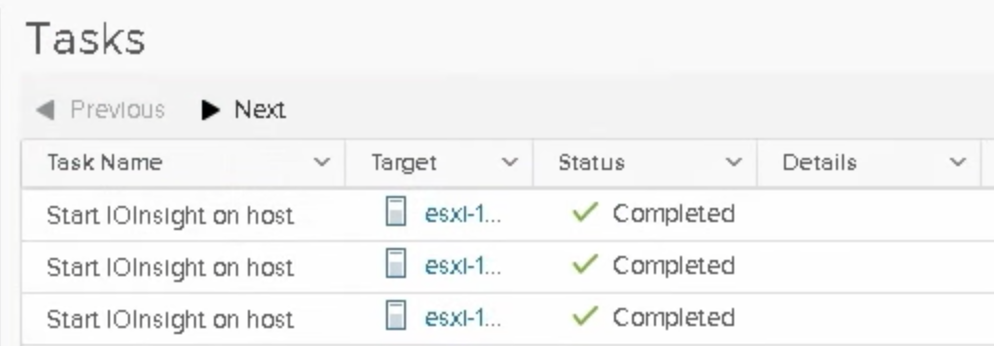
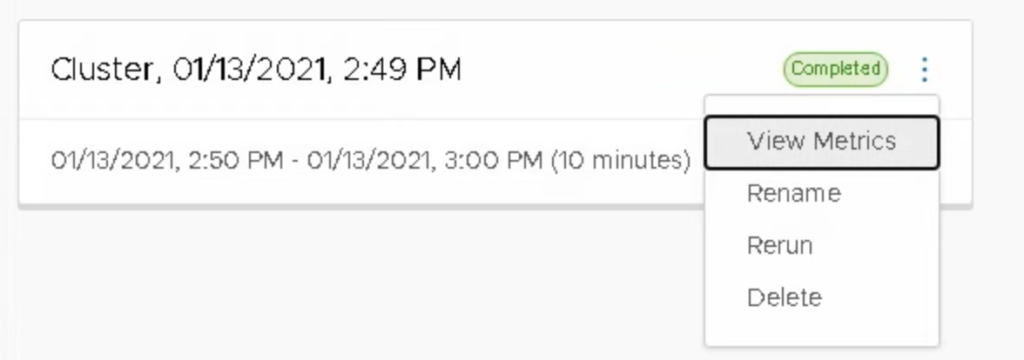
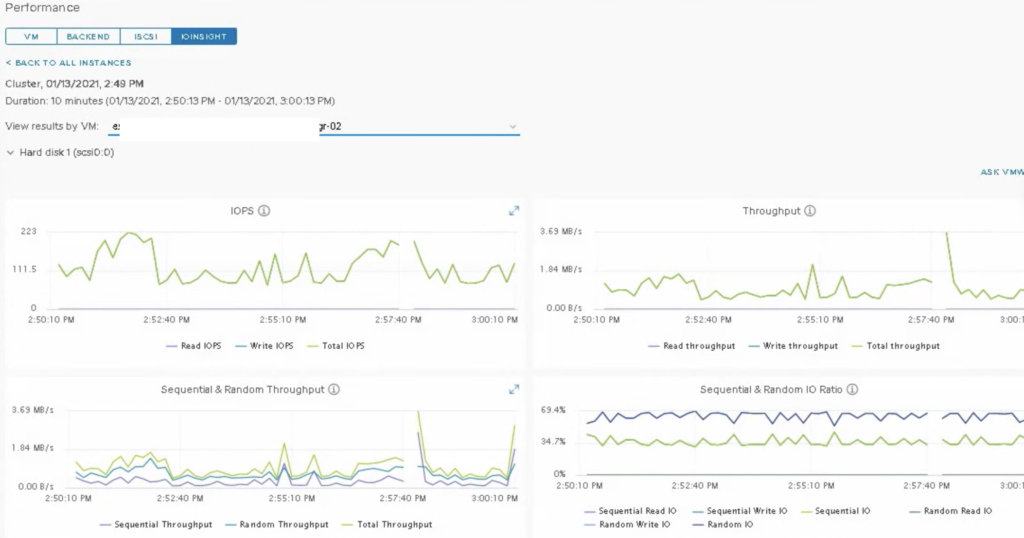
Now the famous VMware fling IOInsight is integrated with vCenter UI performance tab. We can run an instance of it on the selected target hosts and monitor in detail I/O performance of VMs.

I/O Performance comparison between VMs

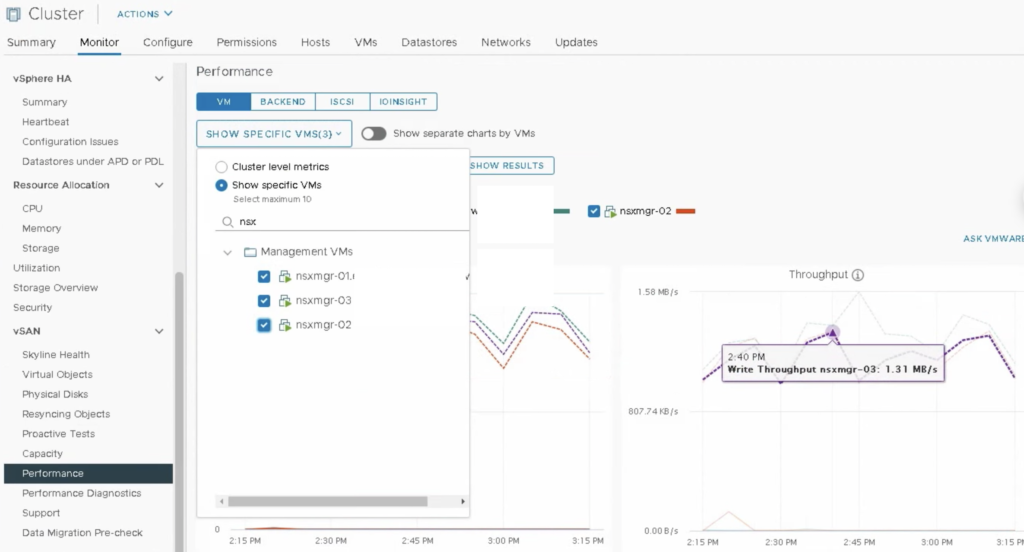
We can now pick up to 10 VMs and compare I/O performance between them for more detailed analysis on how does a certain VM behaves in comparison to others on a shared chart or use separated charts.

vSAN upgrade to 7.0 U1 – format change

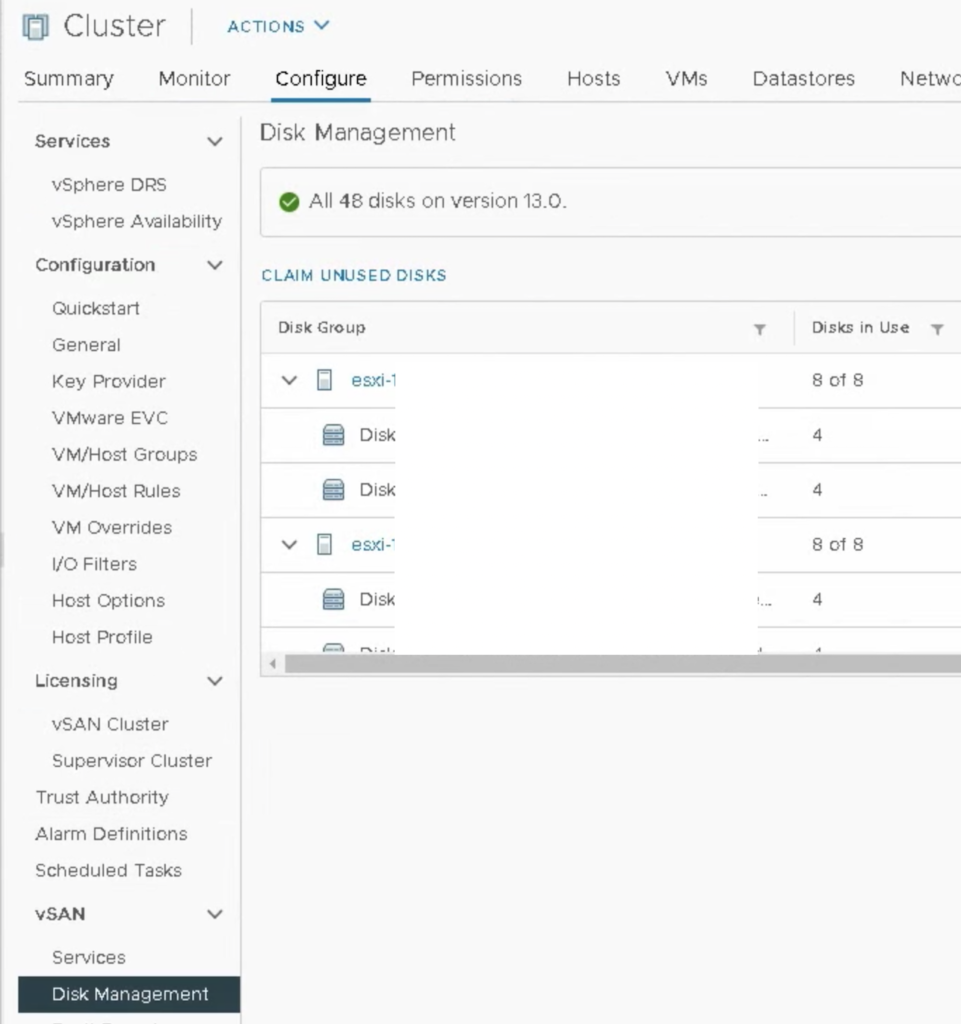
When you upgrade your cluster to 7.0 U1 you get a new disk format version 13.0. And like always, if it is an upgrade from recent vSAN versions like 6.7, no data evacuation is required, it is metadata change only.

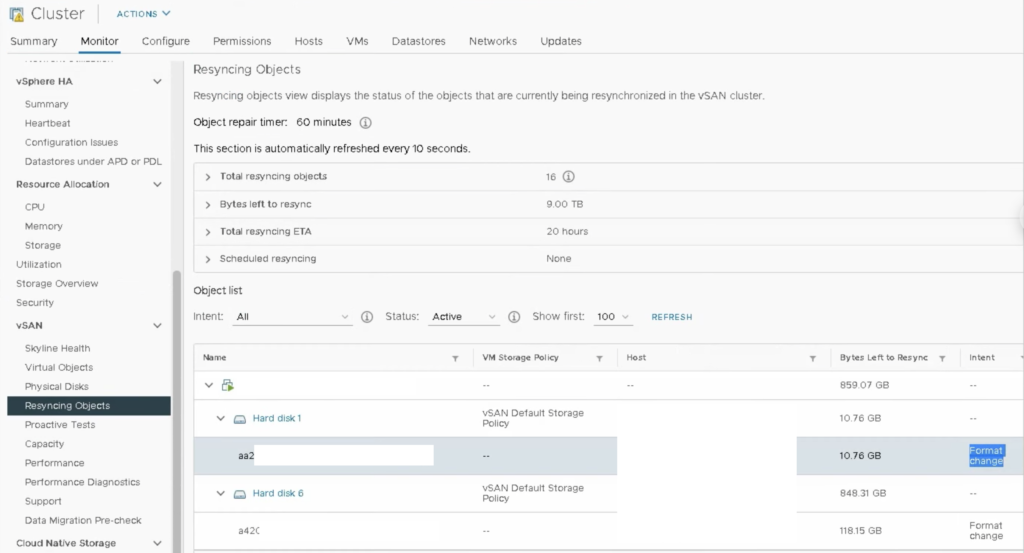
I was sure my update will be quick as previous ones but not this time ;-). I was surprised by a new activity in the Resyncing Objects dashboard called “Format change”.

It turns out that for 7.0 U1 objects that are greater than 255GB have to be rewritten to a new format. My cluster had many of such objects (like VMs with VMDKs of 1 TB ) so it took some time to change their format.

There is also a new Skyline Health test that shows how many objects need a new format:

Why the format change is needed? It is a kind of internal optimisation to allow vSAN to change policies or rebuild with less than 25-30% free space required. So slack space can be smaller from now on which leaves more capacity for workloads.

Basic HCX diagnostics

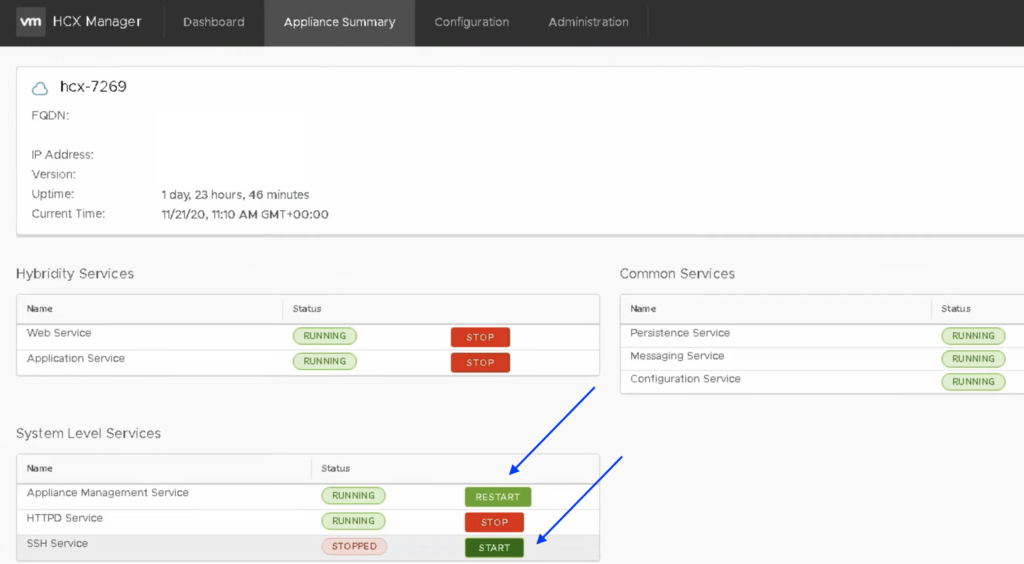
HCX is more just one component, but the main one is called HCX Manager. It is deployed as first and it is the one you can login to using https://FQDN_OR_IP:9443. Web UI is always a first step in troubleshooting because you can quickly check or restart services. And the most important, start SSH service to get to the console.

> ccli

Welcome to HCX Central CLI

Few simple commands that you can ran are:

> list

To list the connected service appliances:

> go 0

to select a specific appliance

> hc -d

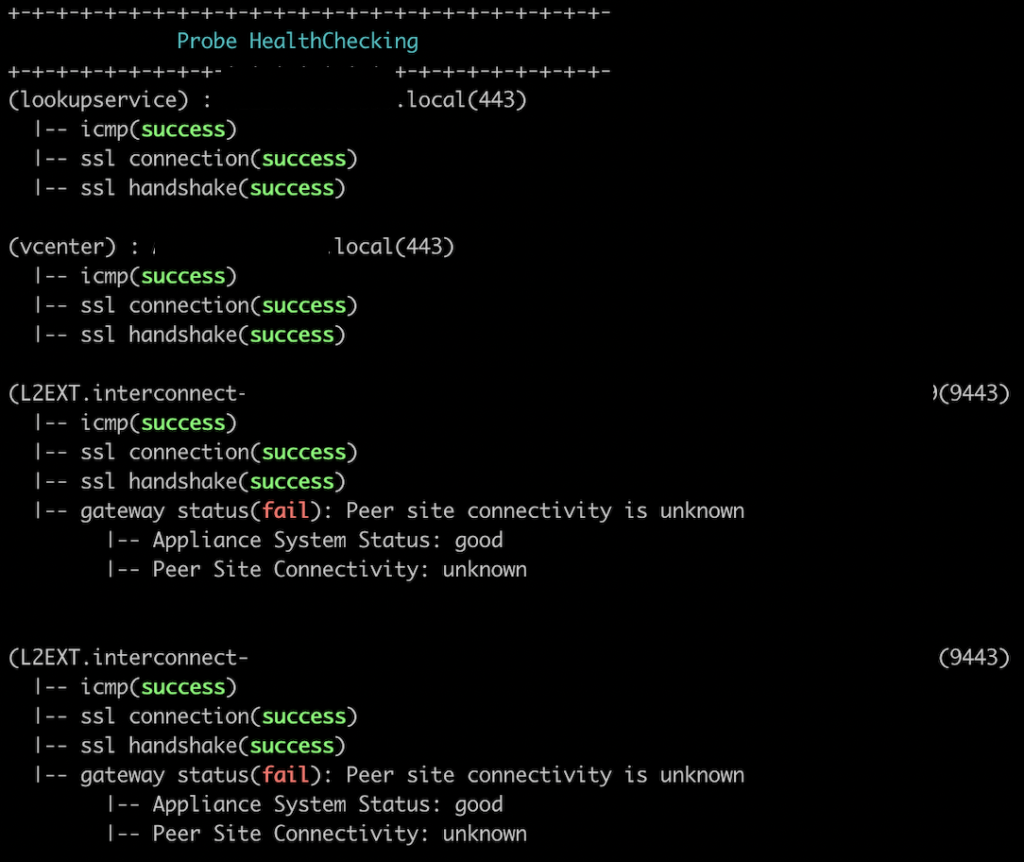
to run a detailed healtcheck on the selected appliance, like this one…it is in a pretty bad shape:

> ssh

to connect to a selected appliance (no username and password required) to check networking, routing etc but also to view the logs. For Interconnect appliance (HCX-WAN-IX) /var/log/vmware/hbrsrv.log and /var/log/vmware/mobilityagent.log are the most valuable in troubleshooting.

To leave ccli just type > exit.

On HCX Manager the best destination for log analysis is: /common/logs/admin/app.log , /common/logs/admin/job.log and /common/logs/admin/web.log.

The most common issues that may occur during setup are mostly networking ones around interconnect between sites, Management Network, Uplink Network and vMotion Network.

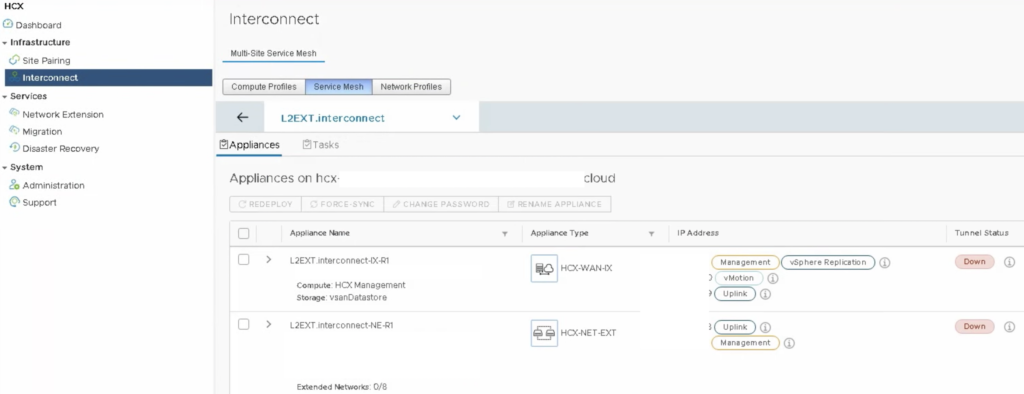
And HCX Plugin in vCenter will show the following: tunnel status down

We can go through a very long list checking open ports running > ping, > netcat -vz : https://ports.vmware.com/home/VMware-HCX

We can take a shortcut as well (not sure if this is supported method but I believe we are good to go if we only want to edit something) and check HCX Mongo DB:

> mongo hybridity

> show collections

will list all the tables in the database. The table that is worth checking is the following (from what I checked it works on HCX Cloud connector/on-prem site where you can RUN DIAGNOSTICS on service mesh ):

> db.ServiceMeshDiags.find().pretty()

Look for entries:

"message" : "Diagnostics completed. There are 7 failed probes.",
"status" : "FAILED",

------------------------------

"status" : "FAILURE",
"error" : {
"output" : "",
"message" : "Failed to reach destination"
}
}
],
"status" : "ERROR",
"message" : "HCX-NET-EXT is unable to reach HCX-NET-EXT-PEER on the ports 4500. Please ensure firewall is not blocking the ports or routing is correctly configured."

------------------------------

{
"type" : "REACHABILITY_HTTPS_CONNECT",
"source" : "x.x.x.x",
"destination" : "x.x.x.x",
"sourcePort" : 0,
"destPort" : 443,
"destType" : "HCX-WAN-IX",
"protocol" : "TCP",
"status" : "FAILURE",
"error" : {
"output" : "",
"message" : "Failed to connect to target"
},

status" : "ERROR",
"message" : "HCX is unable to reach HCX-WAN-IX on the ports 443. Please ensure firewall is not blocking the ports or routing is correctly configured."

-----------------------------

"type" : "REACHABILITY_TCP_CONNECT",
"source" : "x.x.x.x",
"destination" : "x.x.x.x",
"sourcePort" : 0,
"destPort" : 8000,
"destType" : "Deployment_HostSystem",
"protocol" : "TCP",
"status" : "FAILURE",
"error" : {
"output" : "dial tcp x.x.x.x:8000: connect: no route to host",
"message" : ""
},

This table is a real time-saver!

How to check your vSAN Health history?

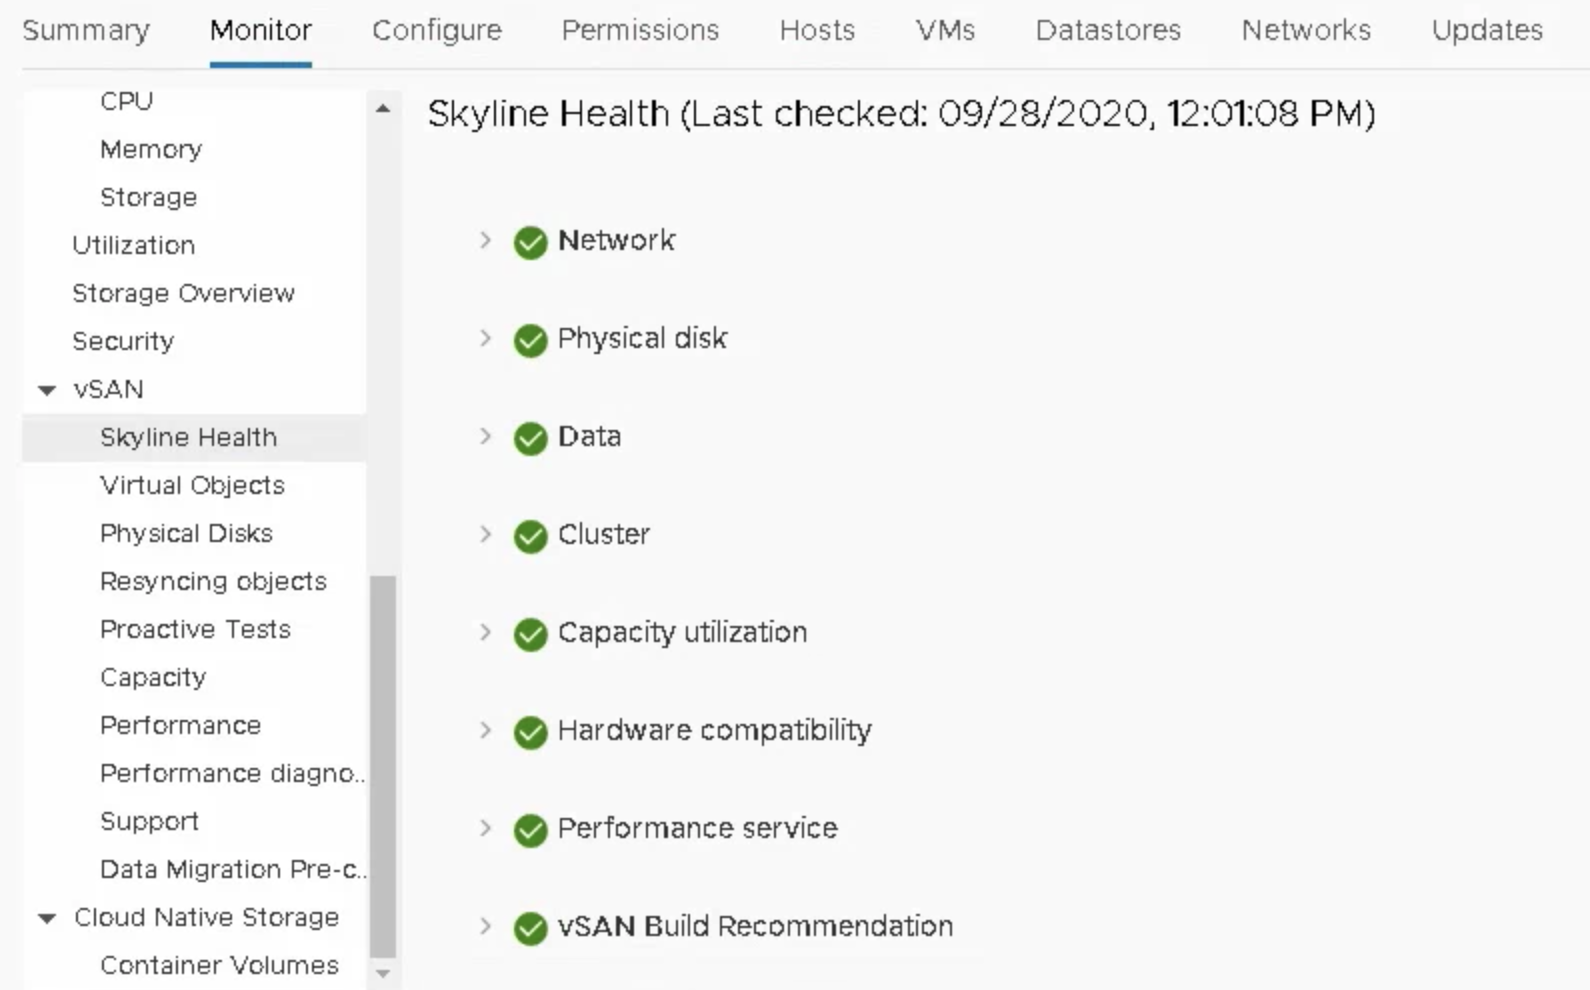
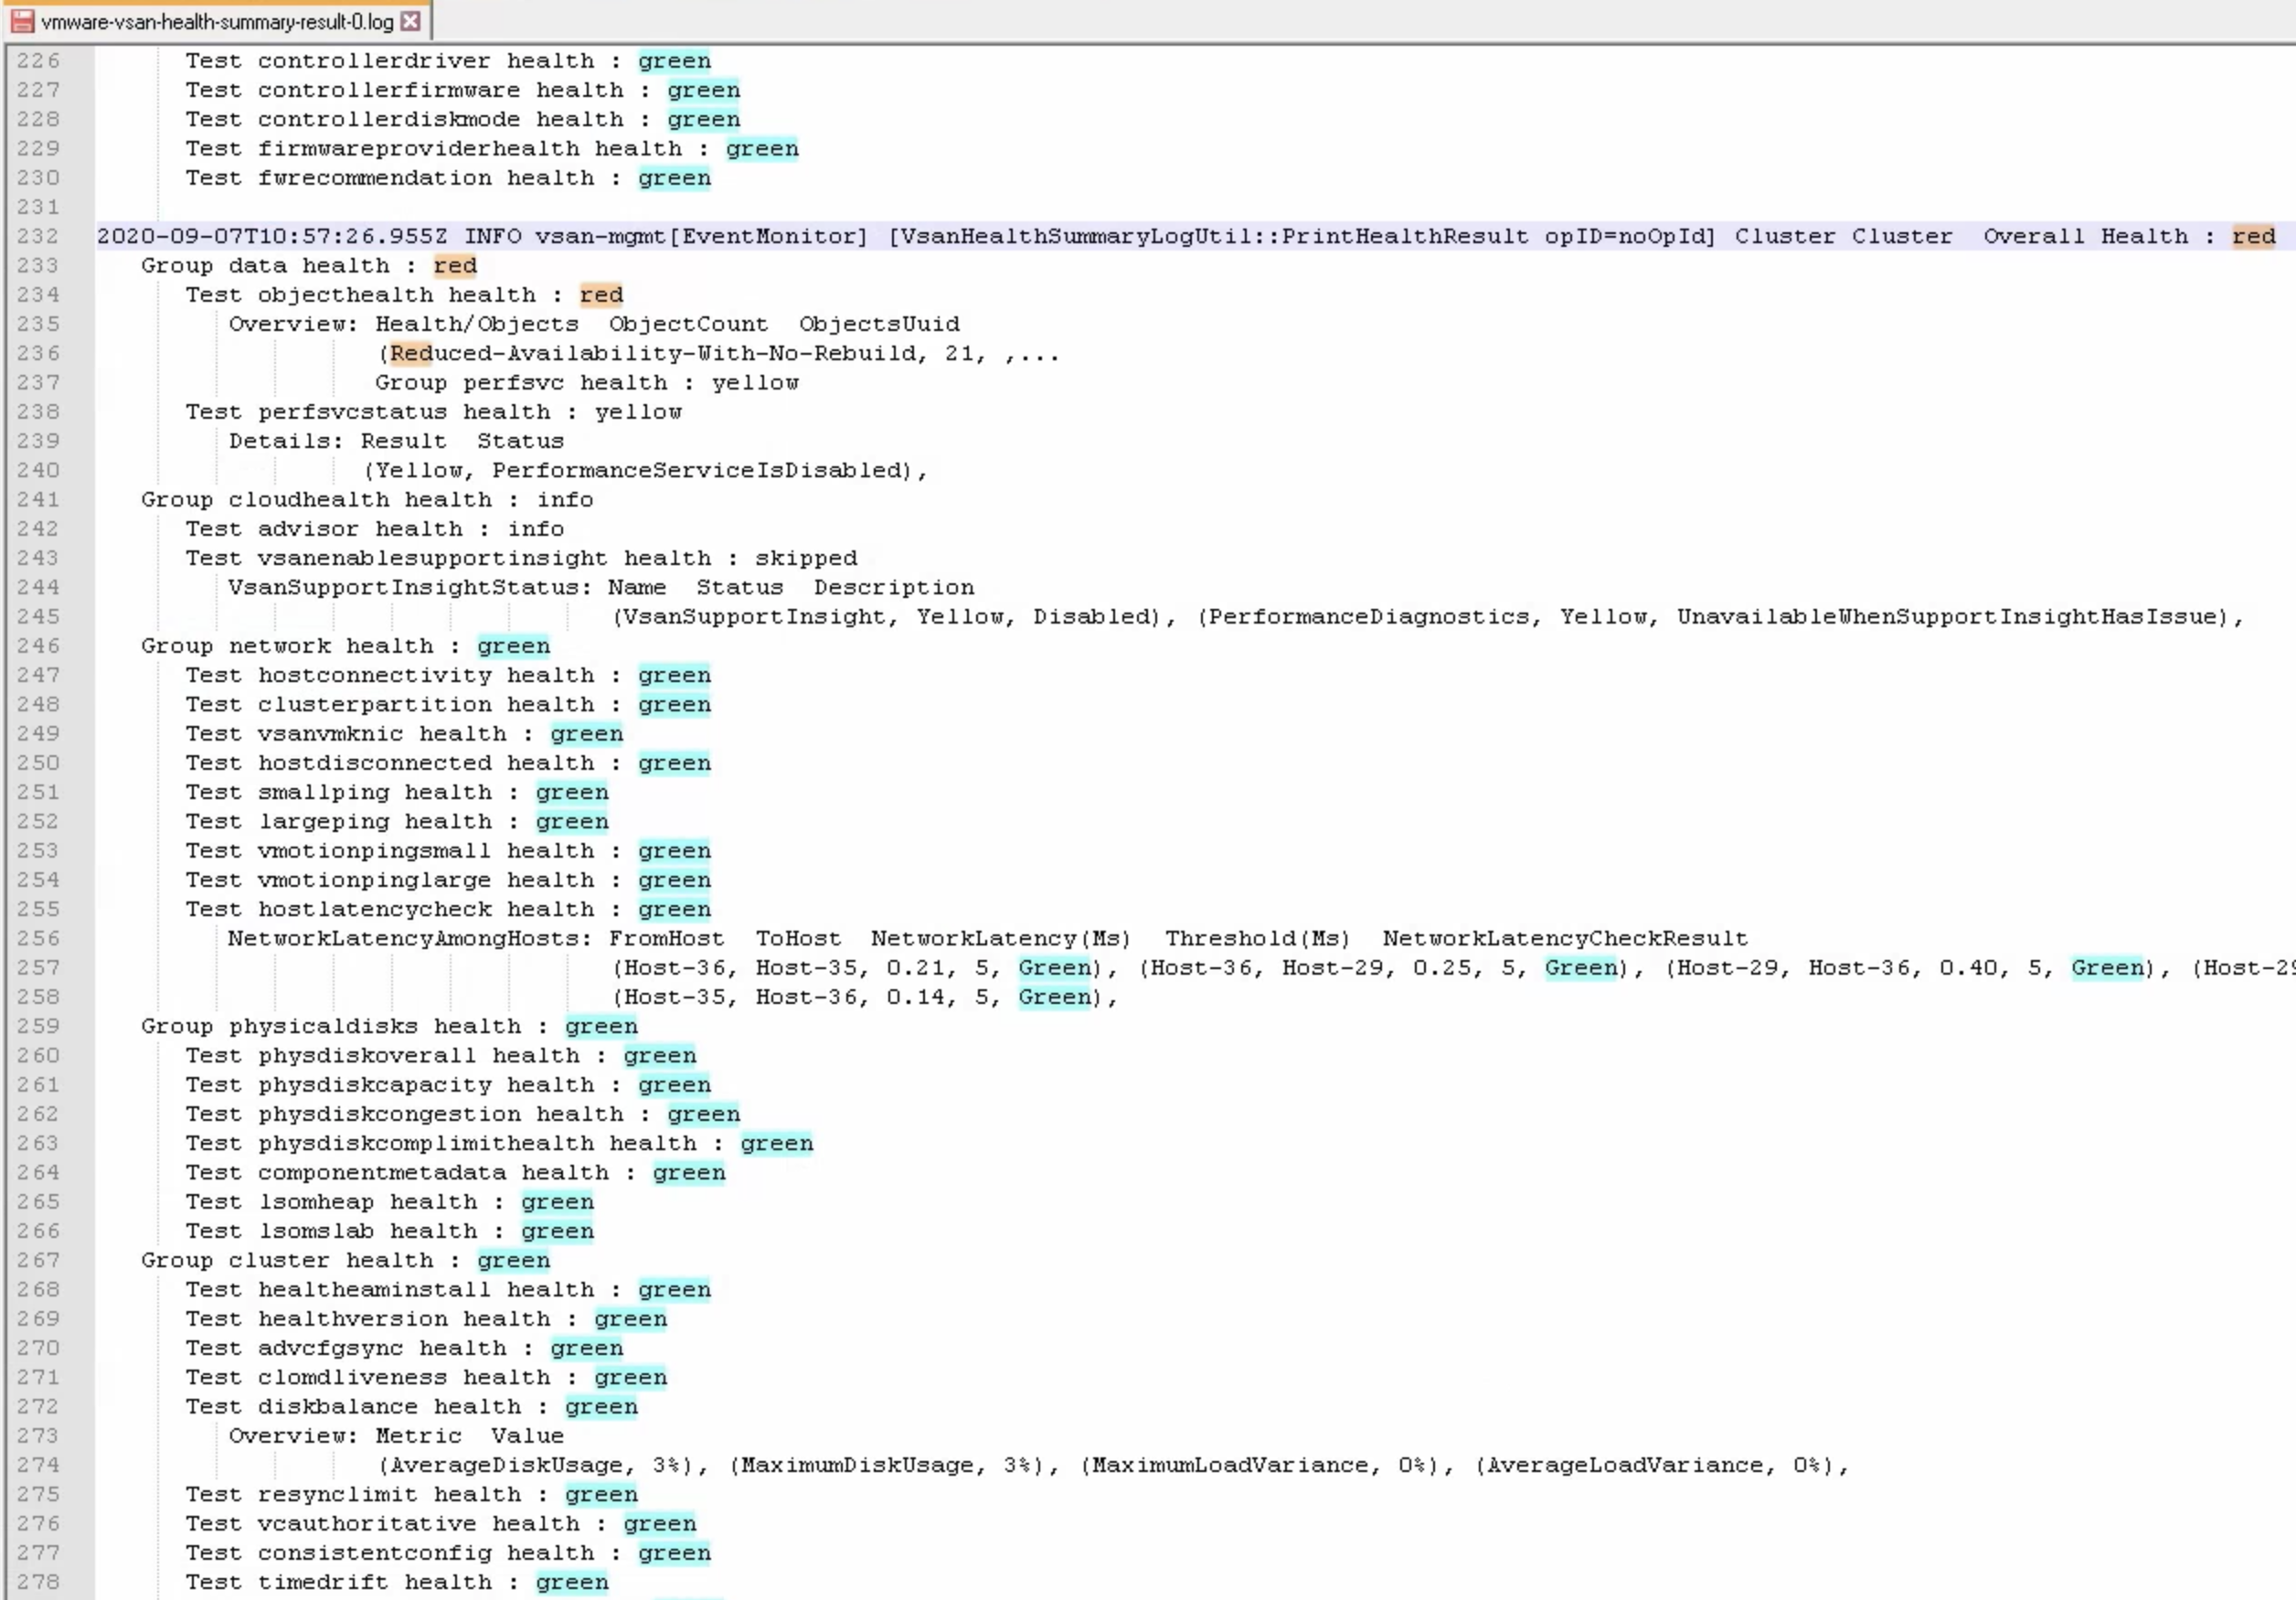
Skyline/vSAN Health is the first place we go when we troubleshoot a vSAN cluster. But in case we have a problem that appears from time to time, it can happen that an updated vSAN Health report will not indicate any problems.

One of the simplest ways to check the historical vSAN Health data is to check them in your vCenter’s log file:

/var/log/vmware/vsan-health/vmware-vsan-health-summary-result.log